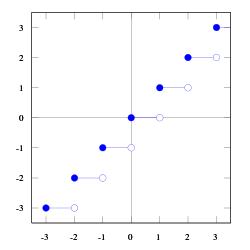
ไฟล์:Floor function.svg
ไปยังการนำทาง
ไปยังการค้นหา

ขนาดของตัวอย่าง PNG นี้ของไฟล์ SVG นี้: 600 × 600 พิกเซล ความละเอียดอื่น: 240 × 240 พิกเซล | 480 × 480 พิกเซล | 768 × 768 พิกเซล | 1,024 × 1,024 พิกเซล | 2,048 × 2,048 พิกเซล | 1,000 × 1,000 พิกเซล
ไฟล์ต้นฉบับ (ไฟล์ SVG ขนาดประมาณ 1,000 × 1,000 พิกเซล, ขนาดไฟล์: 16 กิโลไบต์)
ความย่อ
| คำอธิบาย | |
| วันที่ | 30 มีนาคม พ.ศ. 2549 (original upload date) |
| แหล่งที่มา | งานของตัว |
| ผู้สร้างสรรค์ | No machine-readable author provided. Omegatron (คุย · ส่วนร่วม) assumed (based on copyright claims). |
| เวอร์ชันอื่น |
|
| SVG genesis |


การอนุญาตใช้สิทธิ
Created by User:Omegatron using gnuplot, possibly with post-processing in the GIMP (PNG) or Inkscape (SVG)
ข้าพเจ้า ในฐานะผู้ถือลิขสิทธิ์ของภาพหรือสื่อนี้ อนุญาตให้ใช้ภาพหรือสื่อนี้ภายใต้เงื่อนไขต่อไปนี้
ไฟล์นี้อยู่ภายใต้สัญญาอนุญาตครีเอทีฟคอมมอนส์ รุ่นแสดงที่มา-อนุญาตแบบเดียวกัน 3.0 ต้นฉบับ, 2.5 ทั่วไป, 2.0 ทั่วไป และ 1.0 ทั่วไป
- คุณสามารถ:
- ที่จะแบ่งปัน – ที่จะทำสำเนา แจกจ่าย และส่งงานดังกล่าวต่อไป
- ที่จะเรียบเรียงใหม่ – ที่จะดัดแปลงงานดังกล่าว
- ภายใต้เงื่อนไขต่อไปนี้:
- แสดงที่มา – คุณต้องให้เกียรติเจ้าของงานอย่างเหมาะสม โดยเพิ่มลิงก์ไปยังสัญญาอนุญาต และระบุหากมีการเปลี่ยนแปลง คุณอาจทำเช่นนี้ได้ในรูปแบบใดก็ได้ตามควร แต่ต้องไม่ใช่ในลักษณะที่แนะว่าผู้ให้อนุญาตสนับสนุนคุณหรือการใช้งานของคุณ
- อนุญาตแบบเดียวกัน – หากคุณดัดแปลง เปลี่ยนรูป หรือต่อเติมงานนี้ คุณต้องใช้สัญญาอนุญาตแบบเดียวกันหรือแบบที่เหมือนกับสัญญาอนุญาตที่ใช้กับงานนี้เท่านั้น

|
อนุญาตให้คัดลอก แจกจ่ายและ/หรือดัดแปรเอกสารนี้ภายใต้เงื่อนไขของสัญญาอนุญาตเอกสารเสรีของกนู รุ่น 1.2 หรือรุ่นใด ๆ นับจากนี้ที่ออกโดยมูลนิธิซอฟต์แวร์เสรี โดยไม่มีส่วนใดห้ามแก้ไข ไม่มีข้อความปกหน้าและปกหลัง สำเนาของสัญญาอนุญาตรวมอยู่ในส่วนชื่อ สัญญาอนุญาตเอกสารเสรีของกนู |
คุณสามารถเลือกสัญญาอนุญาตดังกล่าวตามต้องการ
(In short, this means that you can copy and modify the image freely as long as you provide attribution; preferably in the form of a link back to this page.)
Instructions
See Wikipedia graph-making tips.
 # Set square 1000×1000 SVG output and filename
 # The font size (fsize) sets the size for the circles, too.
 set terminal svg enhanced size 1000 1000 fname "Times" fsize 36
 set output "floor.svg"

 # Set the text value for missing entries in the data file, so we can plot a [[w:discontinuous function|discontinuous function]]
 set datafile missing "Skip"

 # Set y axis limits so the plot doesn't go right to the edges of the graph
 set yrange [-3.5:3.5]
 # Set x axis limits so the first and last points are hidden
 set xrange [-3.5:3.5]

 # No legend needed
 set nokey

 # Add lightly-colored axis lines
 set yzeroaxis
 set xzeroaxis

 # Plot as lines and also points (circles)
 plot "floor.dat" with lines
 plot "floor.dat" with points 1 6

 # Close the file (so I don't have to close gnuplot to view it)
 set output
and data file:
floor.dat
#  X     Y1
   -3    -4
   Skip
   -3    -3
   -2    -3
   Skip
   -2    -2
   -1    -2
   Skip
   -1    -1
   0     -1
   Skip
   0     0
   1     0
   Skip
   1     1
   2     1
   Skip
   2     2
   3     2
   Skip
   3     3
   4     3
Then I opened the resulting SVG file in Inkscape, changed the fill style for the circles (either blue or white fill), brought the plot lines to the top, and then brought the circles to the top (over the lines).
External links
ประวัติไฟล์
คลิกวันที่/เวลาเพื่อดูไฟล์ที่ปรากฏในขณะนั้น
| วันที่/เวลา | รูปย่อ | ขนาด | ผู้ใช้ | ความเห็น | |
|---|---|---|---|---|---|
| ปัจจุบัน | 01:05, 22 พฤษภาคม 2549 | | 1,000 × 1,000 (16 กิโลไบต์) | wikimediacommons>Omegatron | i like blue better |
การใช้ไฟล์
1 หน้าต่อไปนี้ใช้ไฟล์นี้: